
How to Properly Find the Expected Value: A Practical Guide for 2025
The **expected value** is a fundamental concept in probability and statistics, serving as a powerful tool for data analysis and decision-making. Whether you are involved in financial forecasting, risk assessment, or general data interpretation, understanding how to calculate the **expected value** can significantly influence your predictions about outcomes. In this guide, we will explore the concept of **expected value**, the processes involved in its calculation, and its applications in various fields.
The Concept of Expected Value in Statistical Analysis
At its core, the **expected value** represents the **statistical average** of all possible values that a random variable can take, each weighted by its probability of occurrence. Mathematically, it is computed by summing the products of each outcome value and its corresponding probability. This calculation is especially useful in **probability theory**, allowing analysts to estimate future scenarios and make informed decisions based on those predictions. For instance, in **financial forecasting**, understanding the expected returns can help investors gauge the potential profitability of their investments.
Understanding Random Variables
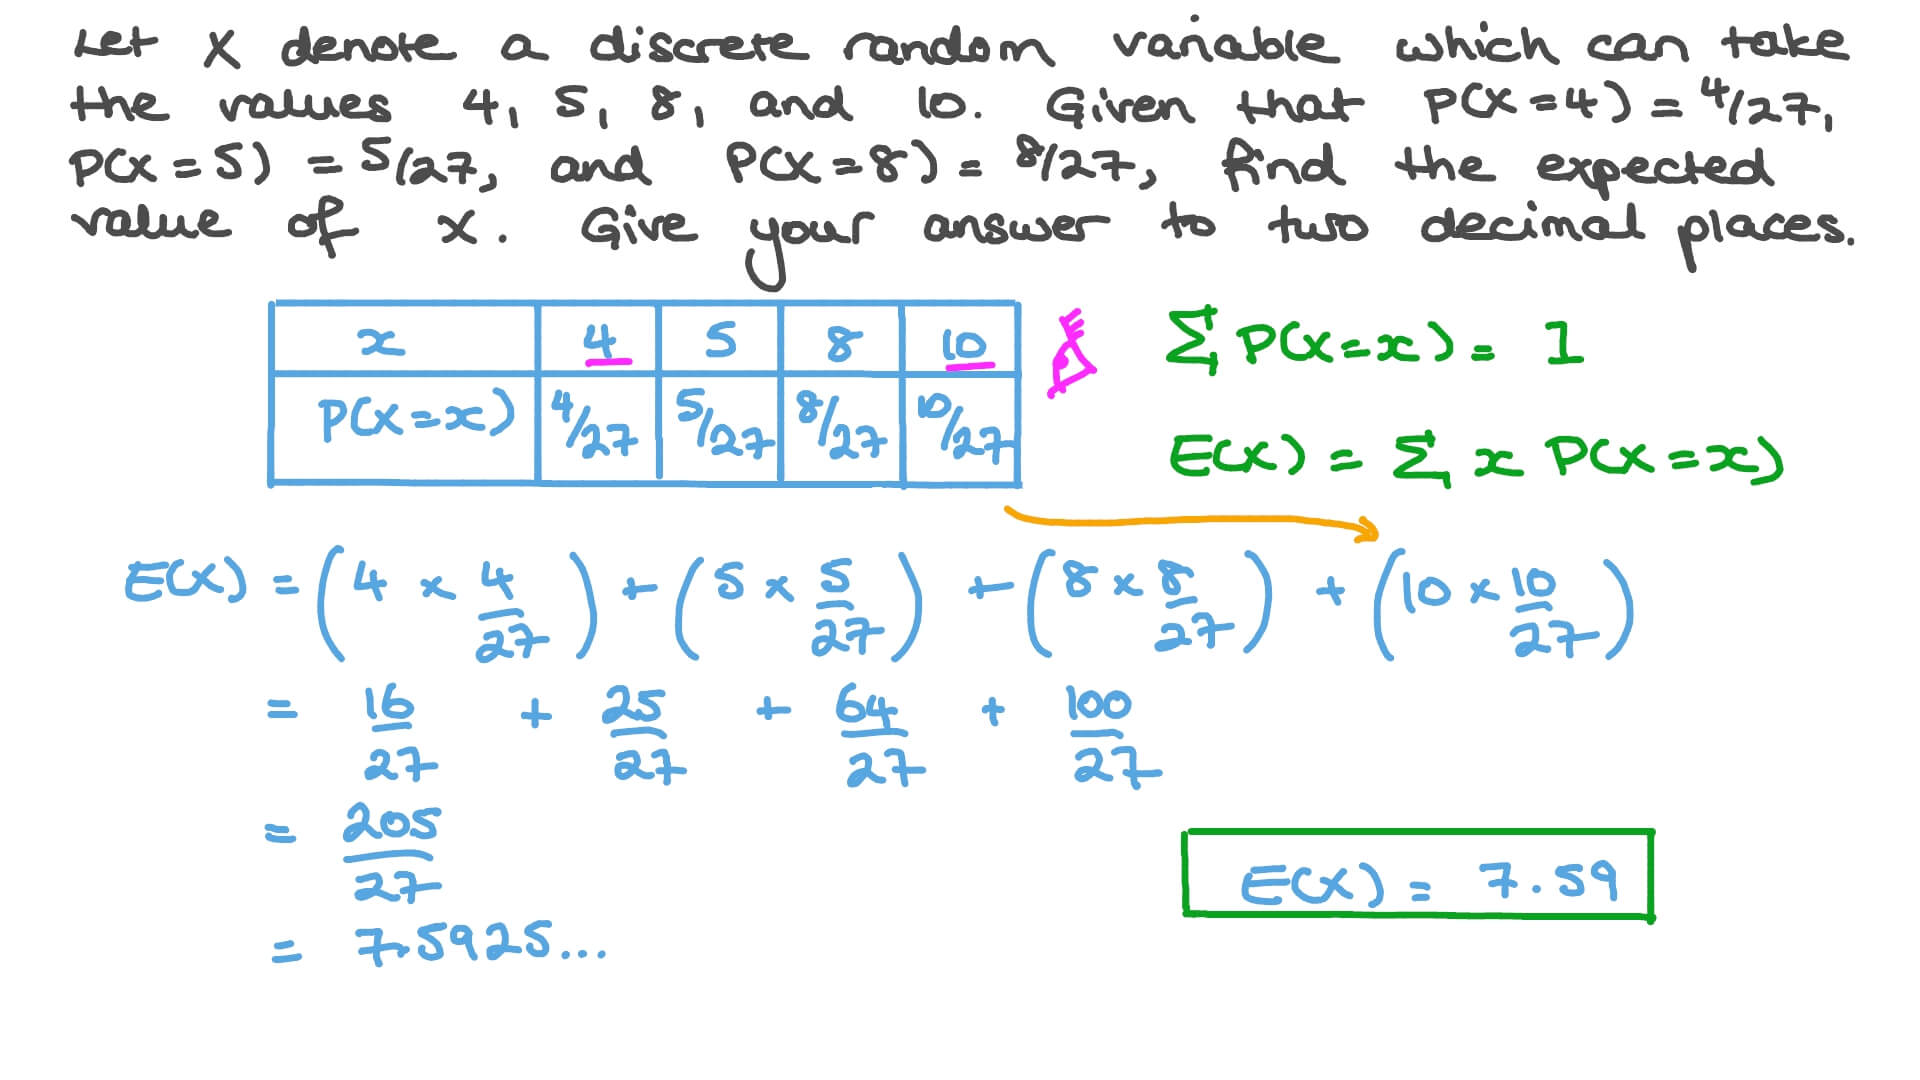
A random variable is a variable whose possible values are numerical outcomes of a random phenomenon. When calculating expected values, the identification of these random variables is crucial. For instance, if you are evaluating a game of chance where you roll a die, each side of the die represents a potential outcome. By assigning probabilities to each side (e.g., 1/6 for each number from 1 to 6), you can effectively compute the **expected score**. The formula simplifies to:
Expected Value (E) = Σ (Outcome × Probability). As you analyze various scenarios, the concept of **expected utility** often emerges, incorporating individual preferences into outcome assessments.
Applications in Decision-Making and Financial Forecasting
Calculating the **expected value** plays a pivotal role in **decision-making** processes. Individuals and businesses alike rely on expected gains and losses to devise strategies and manage risks. In instances of **risk management**, professionals may use expected value calculations to evaluate the likelihood of different outcomes, thereby controlling uncertainties in potential investments. The utility of this approach extends to **portfolio management** as well; understanding the **expected returns** helps investors optimize their asset allocation effectively.
Risk Assessment: A Quantitative Approach
When integrating expected value into risk assessment frameworks, analysts conduct a thorough evaluation of potential risks linked to particular decisions. By calculating the expected value of different outcomes, you can quantify risk factors and compare them against probable gains. This **value assessment** enables decision-makers to adopt strategies that are not only beneficial on average but also mitigate significant losses. For example, in scenarios of product launches, conducting a detailed **profit estimation** based on expected values can lead to better resource allocation and maximize profitability.
How to Calculate the Expected Value
Calculating the **expected value** might seem challenging at first glance, but breaking it down into manageable steps makes the process accessible. There are different formulas you can use depending on the context, but the general process remains the same across applications, whether in simple games of chance or complex investment portfolios.
Step-by-Step Calculation
To calculate expected value, follow these straightforward steps:
1. **Identify all possible outcomes:** Begin by determining each outcome that can result from the process in question.
2. **Determine probabilities:** Assign a probability to each outcome based on historical data or theoretical distribution.
3. **Calculate weighted values:** Multiply each outcome by its probability to obtain its weighted value.
4. **Sum the results:** Add all the weighted values together to yield the **expected value**.
For example, if a simple game pays out $100 for rolling a six with a fair die, the expected gain for this game can be calculated as follows:
E = (100 × 1/6) + (0 × 5/6) = $16.67. Here, the game, on average, results in a gain of $16.67 per roll.
Using Probability Distributions for Expected Value
Complex scenarios might require the application of **probability distributions** to calculate more accurate **expected values**. Distribution functions like the normal distribution or binomial distribution are not only pivotal in using historical data effectively but also essential for calculating future outcomes based on established patterns. For instance, **predictive modeling** in financial metrics often uses these distributions to assess expected losses or gains under varying market conditions. By grounding these calculations in statistical significance, you can ensure more reliable forecasting outcomes.
Total Expected Value in Scenario Analysis
Another practical approach is using scenario analysis to factor in uncertainty levels for various outcomes. By defining different scenarios (e.g., best, worst, and moderate) and calculating a corresponding expected value, decision-makers gain insights into potential fluctuations. This strategy enhances **performance forecasting** and can adjust business strategies to optimize results. For example, a company contemplating whether to launch a new product can summarize scenarios and their respective expected outcomes to ascertain profitability.
Interpreting the Expected Value Results
<pOnce the calculation is complete, interpreting the expected value involves more than just presenting a number. Understanding what the **expected results** signify regarding risk, potential gains, and losses can lead to smarter decision making.
Comparing Expected Values Across Options
Analysts often compare expected values across various options to facilitate **valuations** in decision-making processes. This comparative analysis can illuminate which option presents a more favorable risk-return tradeoff. In finance, investors gauge expected returns from multiple investment portfolios to ensure tailored asset management strategies. This **financial metric** proves essential for evaluating opportunities across competing projects or investments, enabling more robust planning.
Limitations of Expected Value in Predictive Modeling
The expected value calculation does have limitations, especially in widely varying scenarios. It combines outcomes with limited perspectives and does not represent the risks inherent in extreme situations—what statisticians refer to as fat tails in probability distributions. Evaluating outcomes may require deeper analyses, including variance and standard deviation, to capture the true volatilities associated with uncertain scenarios adequately. Therefore, while the expected value serves as a guiding metric, it must not be the sole basis for decision-making.
Visualizing Expected Value: Tools and Techniques
Data visualization tools enhance understanding of expected values significantly. Creating graphs and charts helps stakeholders observe distribution patterns and alignment among different valuation methods. Utilizing bar graphs for visual comparisons can clarify how potential monetary returns align with their respective probabilities. Tools such as Monte Carlo simulations or heat maps can also facilitate expert-level analyses, aiding in comparing multiple scenario expectations effectively.
Key Takeaways
- The expected value serves as the mathematical foundation for analyzing potential outcomes based on probability and risk factors.
- Calculating expected value involves straightforward arithmetic but must be interpreted in a broader decision-making context.
- Scenario analyses enhance the depth of expected value assessments by accounting for variability in outcomes.
- Data visualization tools can aid comprehension and facilitate better communication of complex expected value analyses.
FAQ
1. What is the expected value in simple terms?
The expected value is the average outcome of a random variable weighted by the probabilities of each possible outcome occurring. It summarizes the long-term average you can expect if an experiment or process were to be repeated multiple times. This makes it crucial in scenarios like **expected payoff** calculations, where outcomes and their probabilities are assessed collectively.
2. How do you find the expected value of a continuous random variable?
To find the expected value of a continuous random variable, you would utilize an integral of the product of the variable’s value and its probability density function over the range of the variable. Mathematically, it is expressed as:
E(X) = ∫ x * f(x) dx within the limits of the random variable’s distribution. This method allows a more refined calculation in cases where outcomes are not discrete.
3. Why is the expected value important in financial forecasting?
The expected value is vital in investment strategies as it aids investors in gauging probable gains and losses. Understanding expected returns can lead to better **risk management** and **decision-making**. Without considering expected value, investors may overlook critical differences between high-risk and low-risk investment options, skewing their resource allocations.
4. How can expected value influence gambling strategies?
In gambling, understanding the **expected value** allows players to formulate strategies that can improve long-term winnings or minimize losses. By analyzing games for their respective expected values, gamblers can make informed decisions regarding which games to play and stake sizes, enhancing their overall game performance.
5. What are the common pitfalls in calculating expected value?
Common pitfalls include ignoring all possible outcomes, misunderstanding probabilities, or failing to appropriately adjust for risk factors. Relying solely on expected value without considering its limitations may lead to poor outcomes, especially in variables with extreme variability. Therefore, integrating variance and other risk metrics is essential for a more accurate assessment.
6. Can you use expected value calculations for non-financial predictions?
Absolutely! **Expected value** calculations are not limited to financial metrics; they can be utilized across various fields—such as health assessments, behavioral predictions, or even in market analysis. Understanding the expected outcomes of specific events helps inform decisions across all types of industries.
7. How does expected value relate to risk assessment?
In risk assessment, **expected value** quantifies potential outcomes associated with decisions, allowing for a comprehensive balance of risks and benefits. By contrast, expected returns various outcomes to maximize effective decision-making, analysts can posture themselves to mitigate major risks while capitalizing on more secure choices.