Effective Ways to Find the Confidence Interval
Understanding the concept of the **confidence interval** is crucial for anyone involved in **data analysis** or **statistical inference**. This practical guide for 2025 aims to demystify the process of calculating and interpreting confidence intervals, highlighting their importance in research methodology and the realm of empirical data. We will explore various techniques, the significance of confidence levels, margin for error, and the practical applications of these intervals in data science and predictive analytics.
Understanding Confidence Intervals
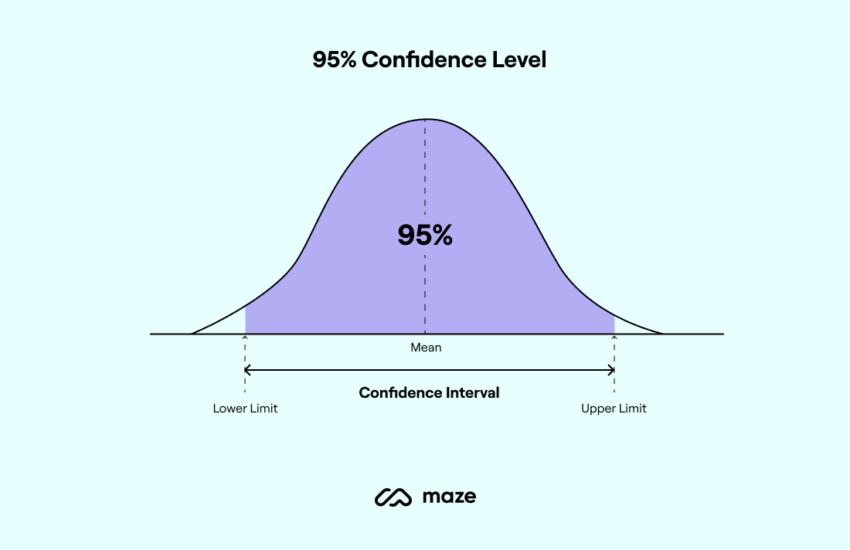
At its core, a **confidence interval** provides a range within which we can say with a certain degree of certainty that a population parameter, like the **population mean**, lies. The **confidence level**, typically expressed as a percentage, reflects how confident we are that the interval contains the true parameter. For example, a 95% confidence level indicates that if we were to take 100 different samples and compute a confidence interval for each sample, then about 95 of the intervals would contain the true population mean.
The Importance of Confidence Level
The choice of **confidence level** fundamentally influences the width of the **confidence interval**. Common choices are 90%, 95%, and 99%. A higher confidence level means a wider interval, as we need to be more conservative to ensure the population mean is captured. For instance, suppose we compute a 95% confidence interval of [50, 70] based on a sample mean of 60. This interval reflects that we are reasonably sure the actual population mean falls within this range. Conversely, selecting a 99% confidence interval might widen the range to [45, 75], thus increasing the likelihood that the true mean is included, albeit potentially sacrificing precision.
Margin of Error in Confidence Intervals
The **margin of error** is a key element in calculating a **confidence interval**. It is the amount of error that can be tolerated when estimating the population parameter, derived from the sample statistics. The formula typically starts with the **critical value**, a statistic that comes from the relevant statistical distribution (normal distribution for large samples or t-distribution for small samples), multiplied by the standard deviation divided by the square root of the sample size. As the sample size increases, the margin of error decreases, thereby offering more **precision in estimates**.
Factors Influencing Margin of Error
Several factors affect the margin of error, including the variability in the data, the chosen confidence level, and sample size. Increased variability in **sample distribution** leads to a wider interval. To illustrate, let’s say two different studies on similar populations yield sample means with different standard deviations. Study A has a standard deviation of 2.5, while Study B has a standard deviation of 5. If both studies use the same sample size and confidence level, Study B will naturally produce a wider **confidence interval**, reflecting higher uncertainty.
Calculating Confidence Intervals
To accurately calculate a confidence interval, a formula is employed, typically structured as follows:
\[ CI = \text{Sample Mean (}\bar{x}\text{)} \pm (Critical\ Value) \times \left( \frac{Standard\ Deviation (s)}{\sqrt{Sample\ Size (n)}} \right) \]
By plugging in empirical data values, researchers can derive insightful conclusions about the population from which the sample was drawn.
Step-by-Step Calculation of Confidence Intervals
Here’s a simplified **step-by-step guide** to calculate a confidence interval:
1. **Determine your sample mean (\(\bar{x}\))**: Gather your data set and compute the average.
2. **Calculate the standard deviation (s)**: This quantifies the variation in your sample.
3. **Choose a confidence level**: Typically, this will be 90%, 95%, or 99%. Find the corresponding critical value from the normal or t-distribution table.
4. **Calculate the margin of error**: Plug your numbers into the margin of error formula mentioned above.
5. **Build your confidence interval**: Combine the sample mean with your margin of error to complete the interval.
For instance, consider a sample mean of 100, a standard deviation of 15, with a sample size of 30 at a 95% confidence level where the critical value is approximately 2.045, the margin will calculate out to be about 5.9, thus the confidence interval becomes [94.1, 105.9].
Utilizing Confidence Intervals in Research
**Confidence intervals** are instrumental in various fields, including **research methodology** and exploratory data analysis. They assist researchers in making data reliable interpretations, allowing them to understand the tone, direction, and possible implications of findings. Consider a **survey analysis** that measures the average income of a population; by calculating a confidence interval for results, you gain insights into how generalized your findings are. It also plays a crucial role in determining the statistical **significance** of your outcomes when integrated into hypothesis testing.
Advanced Techniques for Confidence Intervals
Beyond the traditional methods of calculating confidence intervals, advanced techniques can provide broader insights, especially in complex data situations. Approaches such as **bootstrapping methods** offer non-parametric options that work well when typical assumptions of normality or large sample sizes aren’t met. This flexibility makes bootstrapping invaluable in today’s more diverse network of data sources.
Bootstrapping Methods for Robust Estimates
Bootstrapping involves repeatedly sampling with replacement from an empirical data set to create a large number of simulated samples. This enables estimators of the **population parameters** that can be used to assess **confidence intervals** without overly relying on theoretical distribution assumptions. For example, if you have a data set of survey responses concerning climate change perceptions, running bootstrapping can provide various samples from which to generate confidence intervals, thus allowing for a more comprehensive understanding of perceptions at a broader level.
Using Bayesian Methods for Interval Estimation
**Bayesian methods** offer a unique approach to interval estimation where prior knowledge can be integrated into the analysis, resulting in adaptive estimates that evolve as more data accumulates. By applying Bayesian principles to your data, whether in regression analysis or **statistical models**, researchers can derive confident estimates that reflect both the previous evidence and the newly gathered data, refining predictions and hypotheses.
Significance Testing and Confidence Intervals
In the context of **hypothesis testing**, **confidence intervals** provide essential information beyond just point estimates. They help indicate whether or not a null hypothesis can be rejected based on where a confidence interval lies concerning the **null hypothesis** value. For example, if your confidence interval does not include the null value (often 0 for differences), you may have enough **evidence to reject the null hypothesis**, contributing to statistical significance.
Key Takeaways
- Understanding and effectively utilizing **confidence intervals** is critical for accurate statistical analysis.
- The margin of error and **confidence level** directly influence the estimation and interpretation of population parameters.
- Advanced methods like bootstrapping and Bayesian analysis allow for more robust, flexible data evaluation in complex modeling scenarios.
- Confidence intervals are not just about estimation; they also contribute to hypothesis testing and evaluating **statistical significance**.
- Effective empirical data evaluation and statistical reliability require constant considerations of both the sample size and inherent data variability.
FAQ
1. What is the primary purpose of a confidence interval?
The primary purpose of a **confidence interval** is to provide an estimated range that is likely to include a population parameter. It helps quantify the uncertainty associated with sample statistics, guiding researchers in making data-driven decisions. For example, in a survey measuring consumer satisfaction, a confidence interval around the mean rating can indicate how reliable the sample’s average is in representing the broader population.
2. How does sample size affect the confidence interval?
The sample size plays a significant role in determining the **precision of estimates** within the **confidence interval**. Larger sample sizes typically result in smaller margins of error, producing narrower intervals. This is because a larger data set tends to reduce variability, foreseeing that the sample mean is a better estimate of the population mean. Conversely, smaller samples yield wider intervals, reflecting higher uncertainty and variability among sampled data.
3. Can confidence intervals be used for categorical data analysis?
Yes, **confidence intervals** can also be constructed for categorical data, particularly when estimating proportions. For example, when analyzing survey responses on a yes/no question, researchers can calculate a confidence interval for the **population proportion** of ‘yes’ responses, offering insights into voter behavior or public opinion accuracy.
4. What are the limitations of using confidence intervals?
While confidence intervals offer valuable insights, they are not free of limitations. A confidence interval is only as good as the data it is derived from; biased samples can lead to misleading intervals. Additionally, assuming normality might not hold in smaller samples, making intervals unreliable without proper statistical methods. Thus, consideration of the data collection method and random sampling techniques is crucial for confidence interval validity.
5. How can I improve the reliability of my confidence intervals?
Improving the reliability of **confidence intervals** can involve several strategies:
– Increasing sample size to reduce variability and enhance precision.
– Utilizing stratified sampling to ensure all subgroups are adequately represented.
– Applying bootstrapping techniques to gather more robust estimates, especially in the face of non-normal data.
– Combining **confidence intervals** with other statistical tools to encapsulate more information on the data being analyzed.